Cycle time, and especially its spread
Cycle time is how long a work item takes from “started” to “done”. The average is the least useful view of it. A team whose items usually take three days but occasionally take twenty cannot promise a date, because the date depends on which kind arrives. Look at the spread: the gap between your typical item and your slowest tenth. When that gap widens, the plan is getting less reliable even if the average has not moved.
Work in progress and item age
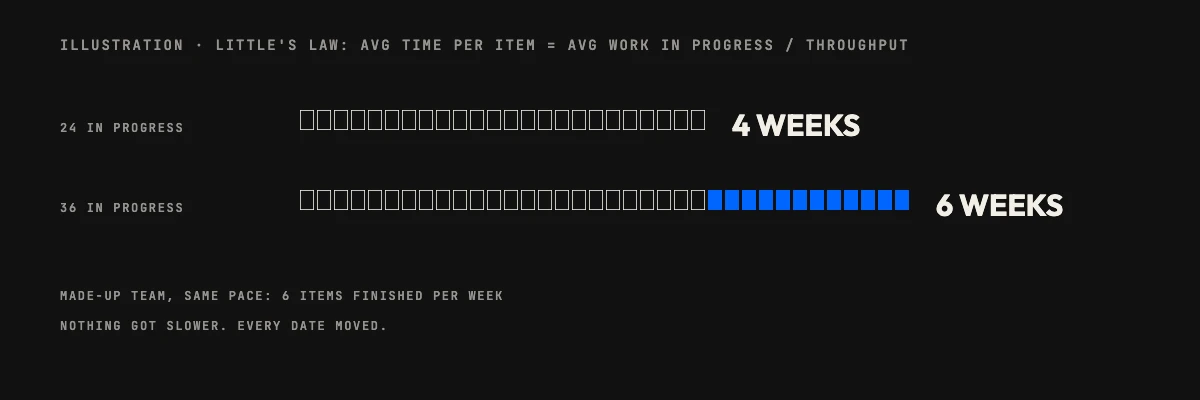
The arithmetic here is Little’s law: in a stable system, the average time an item spends in progress equals the average work in progress divided by the average throughput. A made-up example shows the effect. A team finishing six items a week with 24 in progress takes about four weeks per item. Let work in progress settle at 36 while the team still finishes six a week, and the same sum gives six weeks. Nothing got slower, and every date still moved.
So count items in progress per person, and look at the oldest ones. An item that has sat in “in progress” for twice as long as anything else the team has finished is the one that will be late, and it will usually tell you so a sprint early.
Scope added per sprint
Count the tickets added to a sprint after it started, and the tickets the sprint carried over from the last one. Added scope is not a fault. Unrecorded added scope is, because the date is never re-forecast and nobody agreed to the trade. Our process page says we quote changes in writing before we build them, and this is the reason: the number should never move quietly.
Pull request review wait and blocked time
Measure the time from “pull request opened” to “first review” separately from the time to merge. Waiting for a first review is pure queue, and it grows when senior people are overloaded, which is also when projects start running late. Pair it with blocked time: hours or days an item sat flagged as waiting on a decision, an environment, a client answer or another team. Blocked time is the cheapest of these to collect and the one clients can most often fix themselves.
Unplanned work and rework
Unplanned work is whatever entered the sprint that nobody forecast: production fixes, urgent requests, a data fix for one customer. Track it as a share of the sprint’s capacity. Rework is the same idea at code level: tickets reopened, bugs found in work that was marked done, pull requests sent back more than once. Keep it apart from DORA’s deployment rework rate, which counts deployments forced by incidents. The two share a word and measure different things, and the code-level one moves a sprint or two earlier.
Forecast against actual
Each sprint, write down what you expect to finish, then compare it with what finished. One missed sprint is noise. A run of misses in the same direction is a bias, and it is the best evidence you will get about whether the next date is real. If the forecast has been optimistic four sprints running, the fifth probably will be too.
Software delivery metrics at a glance: what each one predicts
| Metric | What it predicts | Warning sign | How to measure |
|---|---|---|---|
| Cycle time spread | Whether a date can be promised at all | The slowest items drift away from the typical ones | Started and done timestamps on tickets, grouped by size |
| Work in progress and item age | Average time to finish an item | Open items climbing faster than finished ones; one item far older than the rest | A daily count of in-progress tickets and their age |
| Scope added per sprint | A missed sprint goal | Tickets added mid-sprint with no re-forecast | Tickets created after sprint start, plus carry-over |
| Review wait | Queues building around senior reviewers | Pull requests waiting longer for a first look than they used to | Opened-to-first-review time from your Git host |
| Blocked time | Decisions or access holding up the team | The same blocker cited in consecutive stand-ups | A “blocked” flag with a reason and a start date |
| Unplanned work | Capacity quietly shrinking | Urgent items taking a growing share of the sprint | Tickets tagged unplanned, as a share of the sprint |
| Rework | Quality debt landing in later sprints | Reopened tickets and repeat review round trips | Reopen count; review rounds per pull request |
| Forecast against actual | Whether the next date is believable | The same direction of miss, sprint after sprint | Planned against completed items at each sprint end |
Which software delivery metrics lead and which lag
Put the two sets on one timeline and the pattern is plain. Scope added, work in progress and review wait move first, because they describe the inputs. Cycle-time spread and blocked time follow once the queue has built. A missed sprint goal and a slipped date are the visible result. DORA’s measures sit furthest to the right, because they start counting only when a change is committed or deployed.
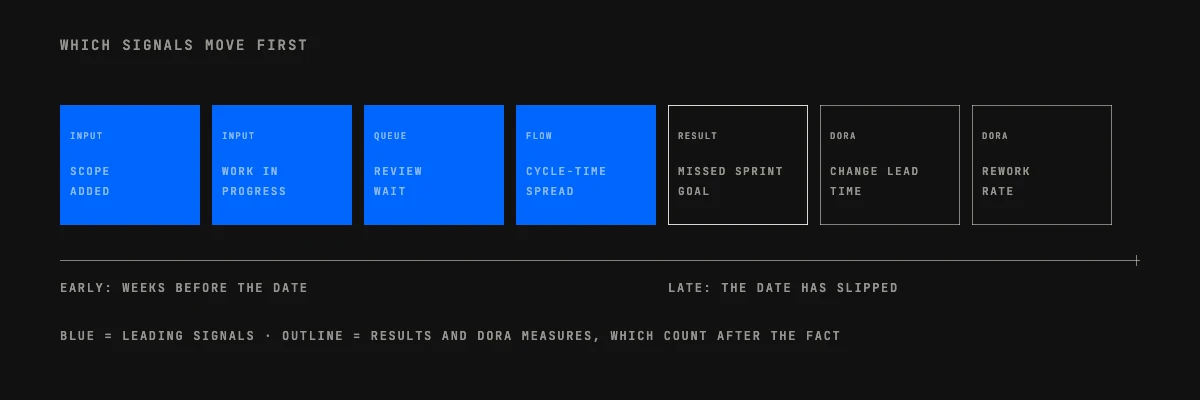
That is not an argument against DORA. DORA’s five tell you how fast and how safely you can ship once the work is done, and they matter for a product that will live for years. They are just the wrong instrument for a question that starts with “will we hit the date?”. For that question, read the left side of the figure.
How to start tracking software delivery metrics
You do not need a metrics platform to begin. Almost everything in the table comes out of Jira, Linear or your Git host as an export. We work in our clients’ own tools, so we begin with what the board already records.
- Pick three: work in progress, scope added per sprint and review wait. They are the cheapest and the earliest.
- Write the definitions down. “Started” and “done” mean something specific on your board, and two people will count them differently otherwise.
- Review them at the sprint demo, in front of the whole team, as questions rather than scores.
- Keep a few sprints of history before drawing any conclusion. A single number has no meaning until you know your own range.
- Add forecast against actual after the first month, once the team trusts the first three.
What to do when a signal turns
A signal is only worth its collection cost if it changes a decision inside the sprint. If work in progress climbs, stop starting and finish something. A lengthening review wait means review goes ahead of new work for a day or two, and someone checks who is overloaded. Scope that keeps arriving gets the trade put in writing: what moves out so this can come in, or what the date becomes. A blocker that repeats goes to whoever owns the decision, with the cost of waiting stated plainly.
The last step is the one teams skip. Tell the client or the sponsor the same week. Bad news early is cheap to fix, and the same news at the deadline is a crisis. If a project is already past the point where these signals help, our 30-day recovery plan covers what to do next.
Mistakes that turn good metrics into bad ones
Four patterns keep showing up. Teams set targets on a single number and then watch that number get gamed: split tickets to shorten cycle time, rush reviews to shorten review wait. Managers compare teams with each other, when each team’s own trend is the only fair baseline. Reviews happen monthly, long after the sprint they describe. And some teams measure only the engineers’ side, while the longest blocked time is often a client approval or a missing credential. A short list, reviewed in the open, with a named decision behind each number, avoids all four.
Software delivery metrics only help if they warn you before a date slips, and the best-known set, DORA’s, mostly reports what has already happened. Throughput and instability figures tell you how a pipeline performs. They do not tell you that sprint four is going to miss its demo. That warning comes from smaller signals that move weeks earlier, and this post sorts the two kinds apart.
Our senior engineers in Ahmedabad work for US, UK and Gulf companies, and every client gets a demo and a written report each fortnight. The detail of how we run sprints and reporting is on our process page. The signals below are the ones we read off the board before we write that report. They are not DORA findings, and none of them comes with a universal threshold, so read the warning signs as patterns to compare against your own team’s history. If you want the broader efficiency argument first, our earlier post on project efficiency covers the strategy side.
What DORA’s software delivery metrics measure now
DORA, the research programme best known for its four key metrics, has moved to five. Its metrics guide, last updated on January 5, 2026, sorts them into two groups. Throughput holds change lead time, deployment frequency and failed deployment recovery time. Instability holds change fail rate and deployment rework rate. DORA’s 2025 year in review, published January 7, 2026, says the four metrics were “officially evolved” into five, and the Quick Check update of April 22, 2026 added deployment rework rate to the tool.
Two of the definitions matter more than the rest here, because they fix what the numbers can and cannot tell you. Paraphrasing the guide:
Notice where the clock starts and stops. Lead time starts at the commit, after the team has planned, argued about and written the work. Rework rate counts unplanned deployments that follow a production incident, so it can only move after something has shipped broken. Both are good measures of a delivery pipeline. DORA did not design either one to forecast a project.
Why these software delivery metrics trail a late project
A project runs late long before its code reaches production. Scope grows in week two. Reviews pile up in week three. Two people block each other in week four. By the time change lead time or recovery time shows it, the date has usually already gone. DORA says as much about its own set: the guide calls the five metrics lagging indicators of delivery practice, and leading indicators of organisational performance and employee well-being. Neither reading is a forecast of one project’s date.
DORA’s year in review, summing up its September 2025 report, points at the same gap from another side: “AI improves throughput, but often at the cost of stability if your foundation isn’t solid.” Moving faster and being on track are different claims, and a single number for either hides the other. This is why we treat DORA’s set as the quarterly health check and keep a second, faster set for the sprint.
We hold the faster set to three tests. It has to come out of the tracker the team already uses, with no new tooling. It has to move while there is still time to act, ideally inside the current sprint. And it has to describe the work rather than the people: once a metric is used to rank developers, people start managing the number instead of the work.
Leading indicators of a late project
We watch eight. Most describe how work flows, how much is arriving or how much comes back; the last one checks the forecast itself.