Clutch's average software project costs $132,480, though its own chart says reviewed projects typically cost $10,000 to $49,999.
37.8% of firms in Techreviewer's 2026 survey charge $30–49 an hour.
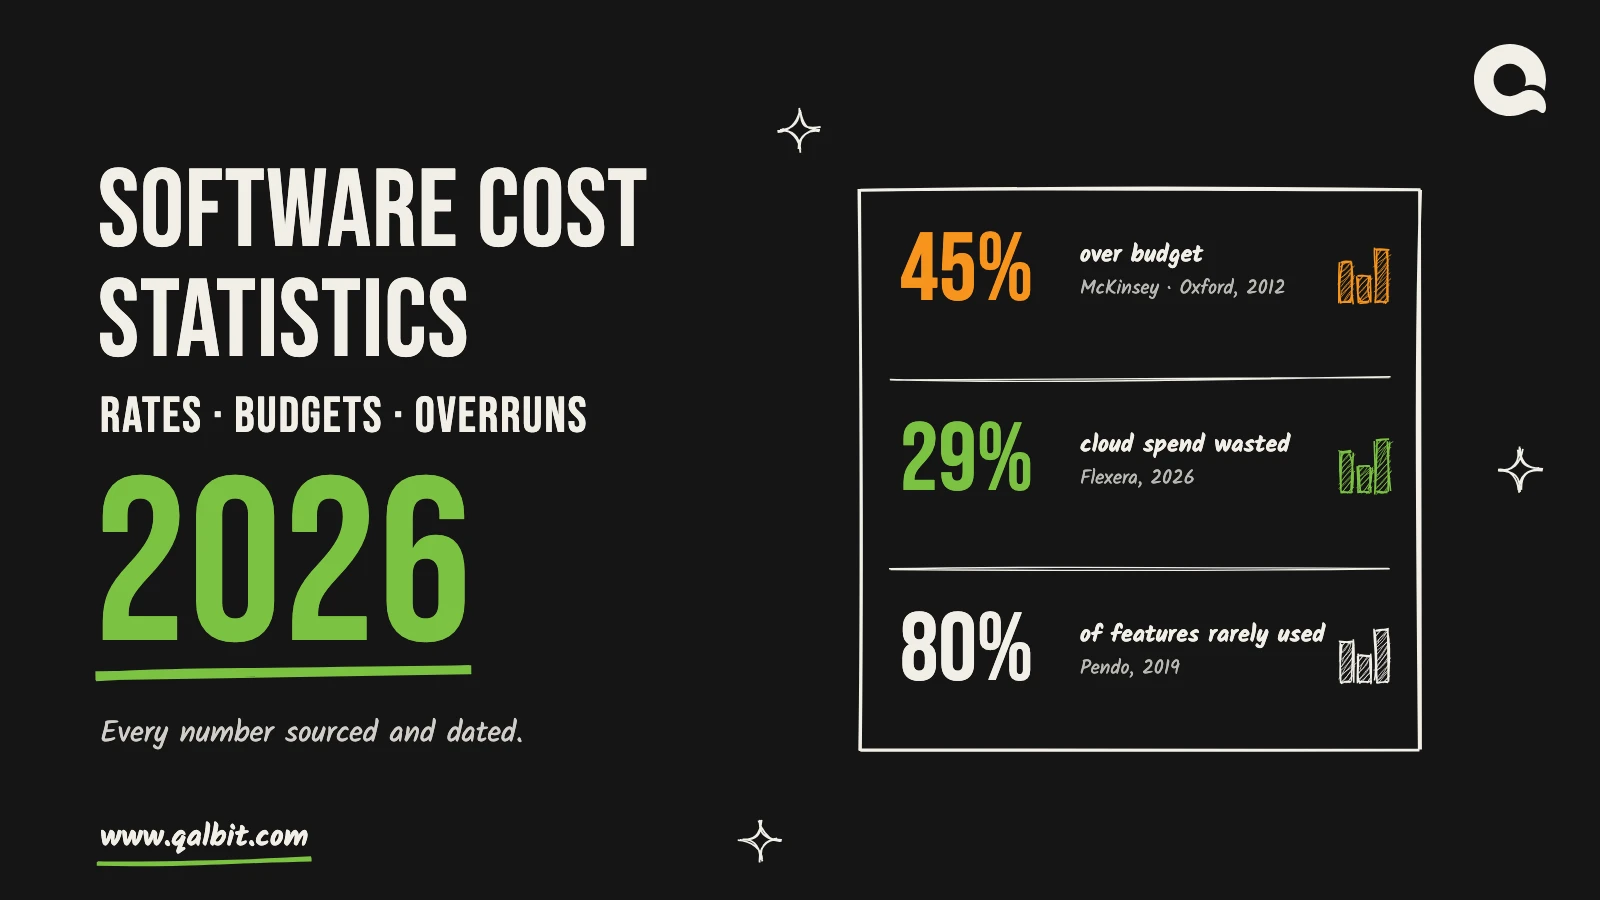
Large IT projects average 45% over budget (McKinsey and Oxford, 2012); across 1,471 IT projects the average overrun was 27%, and one in six averaged 200% (2011).
Wasted cloud spend rose to 29% in 2026 (Flexera), and 80% of features in the average product are rarely or never used (Pendo, 2019).
The '15–20% maintenance a year' rule and the '41% overrun (ISACA)' figure have no source we could find.
Software development cost statistics for 2026: Clutch’s average project costs $132,480, and McKinsey found large IT projects run 45% over budget. Throughout this page, every figure names its source and the date it was published, with a link wherever one exists, so you can check it before you quote it. Where a popular number has no source we could find, we say so in a section of its own.
Our prices are on our website, so buyers often hold them up against a figure they read somewhere else. Plenty of those figures turn out to have no source at all, so this page keeps only the ones that survived a check. To price a project of your own, answer a few questions in the software development cost calculator and it returns a range. Our longer guide to custom software development costs in the USA covers what drives them.
Software development cost statistics at a glance
Statistic
Source
Published
Average software project cost: $132,480
Clutch
Sep 2026
Most common hourly band among firms surveyed: $30–49 (37.8%)
Techreviewer
Mar 2026
Worldwide software spending forecast for 2026: $1.47 trillion, up 15.5%
Gartner
Jul 2026
Large IT projects run 45% over budget on average
McKinsey and University of Oxford
Oct 2012
Average IT project cost overrun: 27%; one in six averaged a 200% overrun
Flyvbjerg and Budzier, HBR
Sep 2011
Wasted cloud spend: 29%
Flexera
Mar 2026
80% of product features rarely or never used
Pendo
Feb 2019
Experienced developers took 19% longer with early-2025 AI tools in one trial (since marked out of date)
METR
Jul 2025
Software development cost statistics: rates and budgets
$132,480 is the average software project cost in Clutch’s review data, with a usual timeline of about 13 months. Clutch’s own chart says reviewed projects typically cost $10,000 to $49,999, so, in other words, a smaller number of large projects is lifting the average. The page gives no median. (Clutch, updated September 2026)
Most software development companies listed on Clutch charge $24 to $49 an hour. However, the same page also gives $25 to $49 as the average cost to hire one. (Clutch, September 2026)
37.8% of 127 software firms surveyed charge $30–49 an hour, 22.05% charge $20–29, 22.0% charge $50–99, 8.66% charge under $20, 6.3% charge $100–149 and 3.15% charge $150–199. The survey ran in January and February 2026, and 70% of respondents work at firms of up to 100 people. (Techreviewer, March 2026)
QalbIT’s own card, for comparison: a dedicated engineer costs $2,600 to $5,600 a month, from QA to tech lead. That is about $16 to $35 an hour on a 160-hour month. Similarly, in our cost calculator, a startup MVP starts at $6,500 and phase one of a custom ERP tops out at $52,500. (QalbIT pricing)
Hourly rates across 127 software firms surveyed in January and February 2026 (Techreviewer)
Market size
Gartner expects worldwide software spending to reach $1,468 billion in 2026, a 15.5% rise on 2025’s $1,271 billion, inside total IT spending of $6.37 trillion, itself up 14.2%. Gartner attributes the growth to investment in AI infrastructure and software. (Gartner, July 2026)
Overruns and project outcomes
Budget, schedule and scope overruns
On large IT projects, budgets are exceeded by 45% on average and schedules by 7%, and the value delivered falls 56% short of plan. Large means an initial budget above $15 million; the database held more than 5,400 projects. (McKinsey and University of Oxford, October 2012)
Comparing budgets with actual costs on 1,471 IT projects, overruns averaged 27%. The average hides a long tail: one project in six, which the authors call black swans, averaged a 200% cost overrun and ran close to 70% late. The sample leaned heavily on public agencies (92%) and US projects (83%), though the authors found little difference in the rest. (Flyvbjerg and Budzier, Harvard Business Review, September 2011)
Software projects overrun their cost estimates by about 30% on average. The figure comes from a 2003 review of estimation surveys by Moløkken and Jørgensen, as cited by Jørgensen in 2006. (Jørgensen, International Journal of Project Management, 2006)
52% of projects completed in the prior 12 months had scope creep or uncontrolled changes to scope, against 43% five years before. The source is the Pulse of the Profession survey PMI ran in 2018. (PMI, PM Network, July 2018)
Success rates and a public-sector overrun
29% of software projects were successful, 52% challenged and 19% failed in 2015, in the Standish Group’s CHAOS database. Across 2011 to 2015, agile projects succeeded 39% of the time against 11% for waterfall, in a set of more than 10,000 software projects. Both figures come from the tables InfoQ published with its interview. (Standish Group via InfoQ, October 2015)
Obligations for the federally facilitated marketplace system behind HealthCare.gov grew from $56 million to more than $209 million between September 2011 and February 2014. (US Government Accountability Office, July 2014)
Successful, challenged and failed projects in Standish Group's CHAOS data, 2015 and 2020
Maintenance and running costs
Maintenance typically takes 40 to 80 percent of what software costs, 60 percent on average. Within maintenance, enhancements rather than error fixes make up roughly 60 percent of the bill. (Robert L. Glass, Facts and Fallacies of Software Engineering, Addison-Wesley, facts 41 and 42, 2002)
Wasted cloud spend went up to 29%, its first rise in five years, which Flexera puts down to a surge in cloud-based AI workloads. Its global survey had over 750 respondents, all cloud decision-makers or users. (Flexera State of the Cloud, March 2026)
Of 947 commercial codebases Black Duck audited, 87% had at least one vulnerability and 78% had high-risk vulnerabilities. In 92% of them, some components were at least four years out of date. (Black Duck OSSRA, February 2026)
Publishing to the app stores costs $99 a year for Apple’s developer program and a single $25 registration fee for a Google Play developer account. (Apple; Google)
Product and startup economics
80% of the features in an average software product get used rarely or never, by Pendo’s count. It based that on three months of anonymised usage data across 615 customer subscriptions. (Pendo Feature Adoption Report, February 2019)
Running out of capital came up in 70% of the venture-backed startup shutdowns CB Insights analysed, and 43% cited poor product-market fit. It tracked 431 VC-backed shutdowns since 2023, and the analysis covers the 385 for which reasons could be identified. Because many gave more than one reason, the shares add up to more than 100%. CB Insights calls running out of capital “almost always the final cause of death, not the root problem”. (CB Insights, March 2026)
AI and developer productivity
90% of nearly 5,000 technology professionals report using AI at work. AI adoption has a positive relationship with delivery throughput and product performance, and a negative one with delivery stability. (Google DORA report, September 2025)
In a randomised trial of 16 experienced open-source developers working on 246 issues, tasks took 19% longer with early-2025 AI tools. The developers expected a 24% speed-up and, afterwards, still believed AI had sped them up by 20%. However, METR has since marked these results out of date. Its February 2026 follow-up called its own new data “an unreliable signal” of AI’s current effect on productivity. (METR, July 2025)
Hiring and security
Gartner predicts that worldwide, a quarter of candidate profiles will be fake by 2028. In its survey of 3,000 job candidates in the second quarter of 2025, 6% admitted to interview fraud. That meant posing as someone else, or having someone pose as them. (Gartner, July 2025)
Some of the most repeated software development cost statistics don’t survive a search for their source. We leave the first two out of the lists above, and include the third only with a caveat:
“Budget 15–20% of the build cost for maintenance each year.” It appears on almost every page about maintenance cost, and none of those we checked cites a study. The research that exists measures maintenance as a share of lifetime cost, which is a different number.
“System development projects average 25% time overrun and 41% cost overrun (ISACA).” We could not find this in ISACA’s publications, so we leave it out until someone produces the original.
Standish CHAOS figures as a measure of the whole industry. They are widely cited and the primary reports are paywalled; Jørgensen and Moløkken-Østvold published a critique of the methodology in 2006. Use them with that caveat.
How to use these numbers
Statistics like these tell you what usually happens, which is useful when you plan. They are poor at predicting any one project, because each source mixes different sizes, sectors and ways of counting. Use them to test your assumptions, not as a budget.
In a plan, they earn their place in three spots. The overrun figures are the case for a contingency line. The maintenance and cloud figures say a business case should run well past launch day. When a quote lands far outside the Clutch and Techreviewer ranges, ask what it includes before you compare rates, because the gap is usually scope. Finally, when you quote any of these software development cost statistics yourself, keep the source and the date beside it. After all, a figure from 2012 and a figure from 2026 describe different markets.
How we checked these software cost statistics
Each linked statistic was opened at its source in October 2026, and each entry keeps the source’s own base and definitions. The Glass figures come from published quotations of the book. Where a publisher’s page blocked automated access, we read an archived or mirrored copy of the same page; where only a secondary summary was available, the entry says so. Several sources are companies with a commercial interest in their topic, among them Clutch, Flexera, Black Duck, Pendo and CB Insights. So are we, so read their figures, and ours, with that in mind. If you find a number here that has moved, or a better source for one, write to business@qalbit.com and we will update the page with the date of the change.
If you are pricing one project rather than reading about thousands, start with our average cost of custom software development guide. It explains why an average makes a poor budget, and then it walks through a quote line by line.
TagsCloud CostsCustom Software DevelopmentProject CostSoftware Development Cost
Founder of QalbIT Infotech and the engineer who still scopes most of its projects. Writes about what custom software really costs, how build-versus-buy decisions play out two years in, and the delivery habits that keep a product shipping, drawn from CRM, ERP, SaaS and MVP work Abid has been building since 2014 and the products QalbIT runs itself today.
FAQ
Frequently asked questions
Clutch's review data puts it at $132,480, with a usual timeline of about 13 months, though Clutch says reviewed projects typically cost $10,000 to $49,999. In our own cost calculator, typical ranges start at $6,500 for a startup MVP and reach $52,500 for phase one of a custom ERP.
Clutch says most software development companies listed on it charge $24 to $49 an hour, and gives $25 to $49 as the average cost to hire one. In Techreviewer's survey of 127 firms in early 2026, the largest group, 37.8%, charged $30–49 an hour.
Often. McKinsey and Oxford found in 2012 that large IT projects run 45% over budget on average, and Flyvbjerg and Budzier found in 2011 an average 27% overrun across 1,471 IT projects, with one in six averaging a 200% overrun.
Gartner forecasts worldwide software spending of $1,468 billion in 2026, up 15.5% from 2025, within total IT spending of $6.37 trillion.
The evidence is mixed. Google's 2025 DORA report links AI adoption to higher delivery throughput but lower stability. A 2025 METR trial found experienced developers took 19% longer with early-2025 AI tools, but METR has since marked those results out of date and called the data from its February 2026 follow-up an unreliable signal.
Yes. Cite the original source linked beside each figure, and link this page if it helped you find it. Each figure carries its publication date so you can check it is still current.
Software development cost statistics for 2026: Clutch’s average project costs $132,480, and McKinsey found large IT projects run 45% over budget. Throughout this page, every figure names its source and the date it was published, with a link wherever one exists, so you can check it before you quote it. Where a popular number has no source we could find, we say so in a section of its own.
Our prices are on our website, so buyers often hold them up against a figure they read somewhere else. Plenty of those figures turn out to have no source at all, so this page keeps only the ones that survived a check. To price a project of your own, answer a few questions in the software development cost calculator and it returns a range. Our longer guide to custom software development costs in the USA covers what drives them.
Software development cost statistics at a glance
Software development cost statistics: rates and budgets
Market size
Overruns and project outcomes
Budget, schedule and scope overruns
Success rates and a public-sector overrun
Maintenance and running costs
Product and startup economics
AI and developer productivity
Hiring and security
Software cost statistics we could not verify
Some of the most repeated software development cost statistics don’t survive a search for their source. We leave the first two out of the lists above, and include the third only with a caveat: